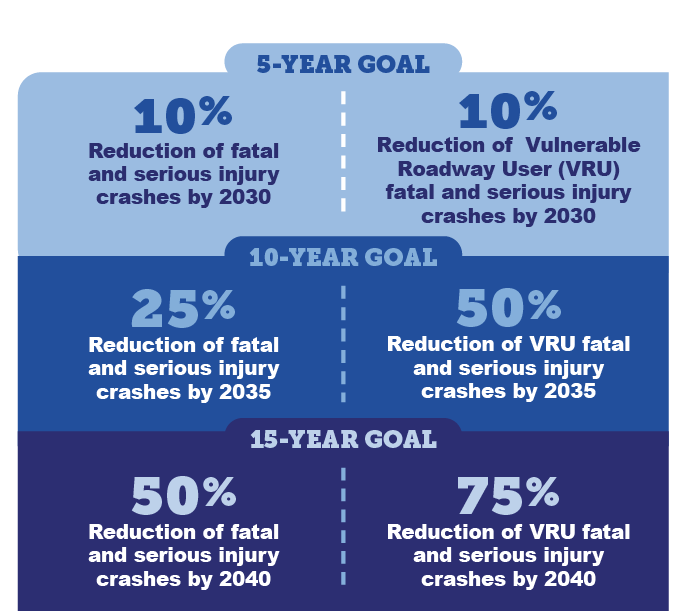
Tracking progress is essential to achieving the vision of safer streets for everyone. The Memphis Safety Action Plan established a shared roadmap for reducing fatal and serious injury crashes and ultimately eliminating traffic deaths and life-altering injuries on Memphis roadways. This page provides a transparent way to monitor progress toward that vision by tracking changes in crash trends over time and measuring outcomes against the plan’s goals.
As implementation moves forward, progress tracking will expand beyond crash data to include information on safety projects, infrastructure improvements, programs, and other strategies that support safer streets. Together, these measures will help residents, decision-makers, and community stakeholders understand where progress is being made, identify areas requiring additional attention, and support continued investment in a safer transportation system for all.
Fatal and Serious Injury Crashes
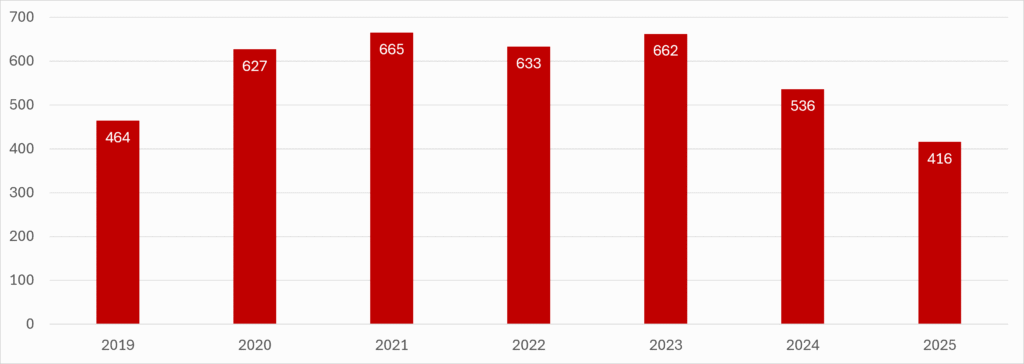
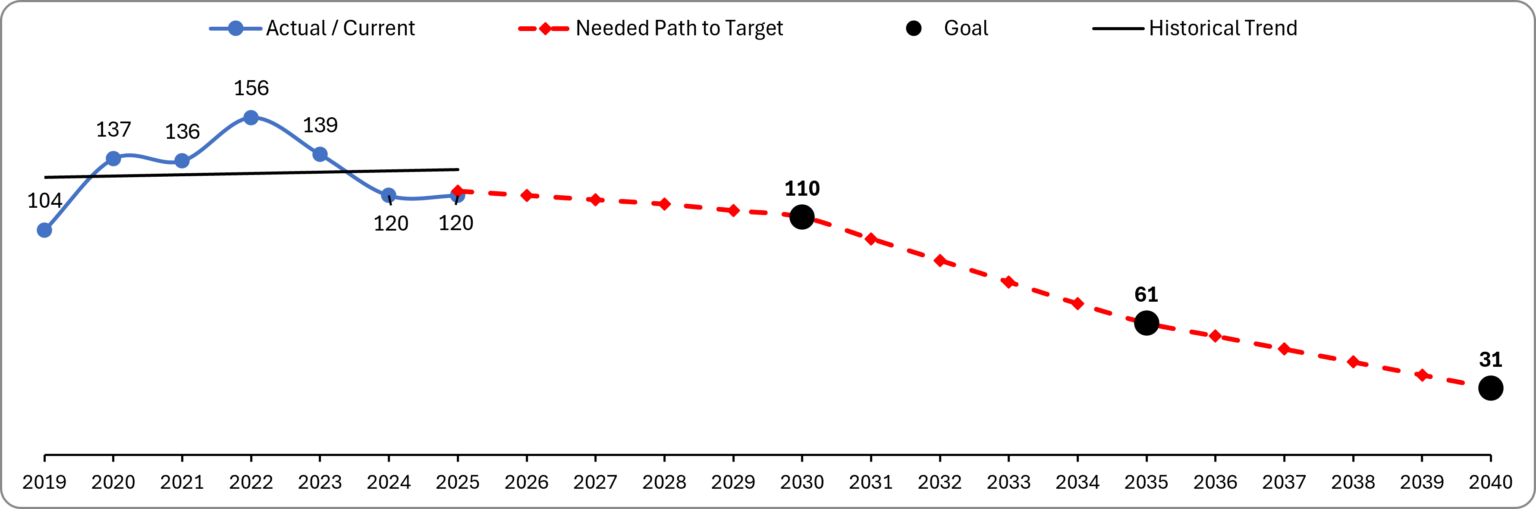
These charts tracks all fatal and serious injury crashes in Memphis and compares current trends with the reduction goals established by the Memphis Safety Action Plan. Monitoring severe crashes over time helps the City and community evaluate whether implemented safety strategies are contributing to safer streets.
Total Crashes by Year
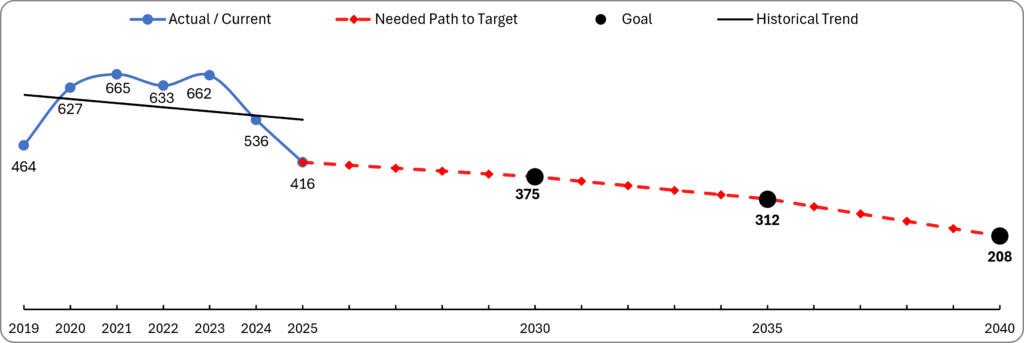
Total Crash Reduction Progress and Future Targets
Actual/Current: shows actual crash trends observed to date, Needed Path to Target: represents the reduction needed to achieve adopted Safety Action Plan goals. Goal: Adopted target levels for 5, 10, and 15 year goals.
Historical Trend: summarizes the long-term pattern in observed crash data.
Fatal and Serious Injury Crashes: Vulnerable Road Users
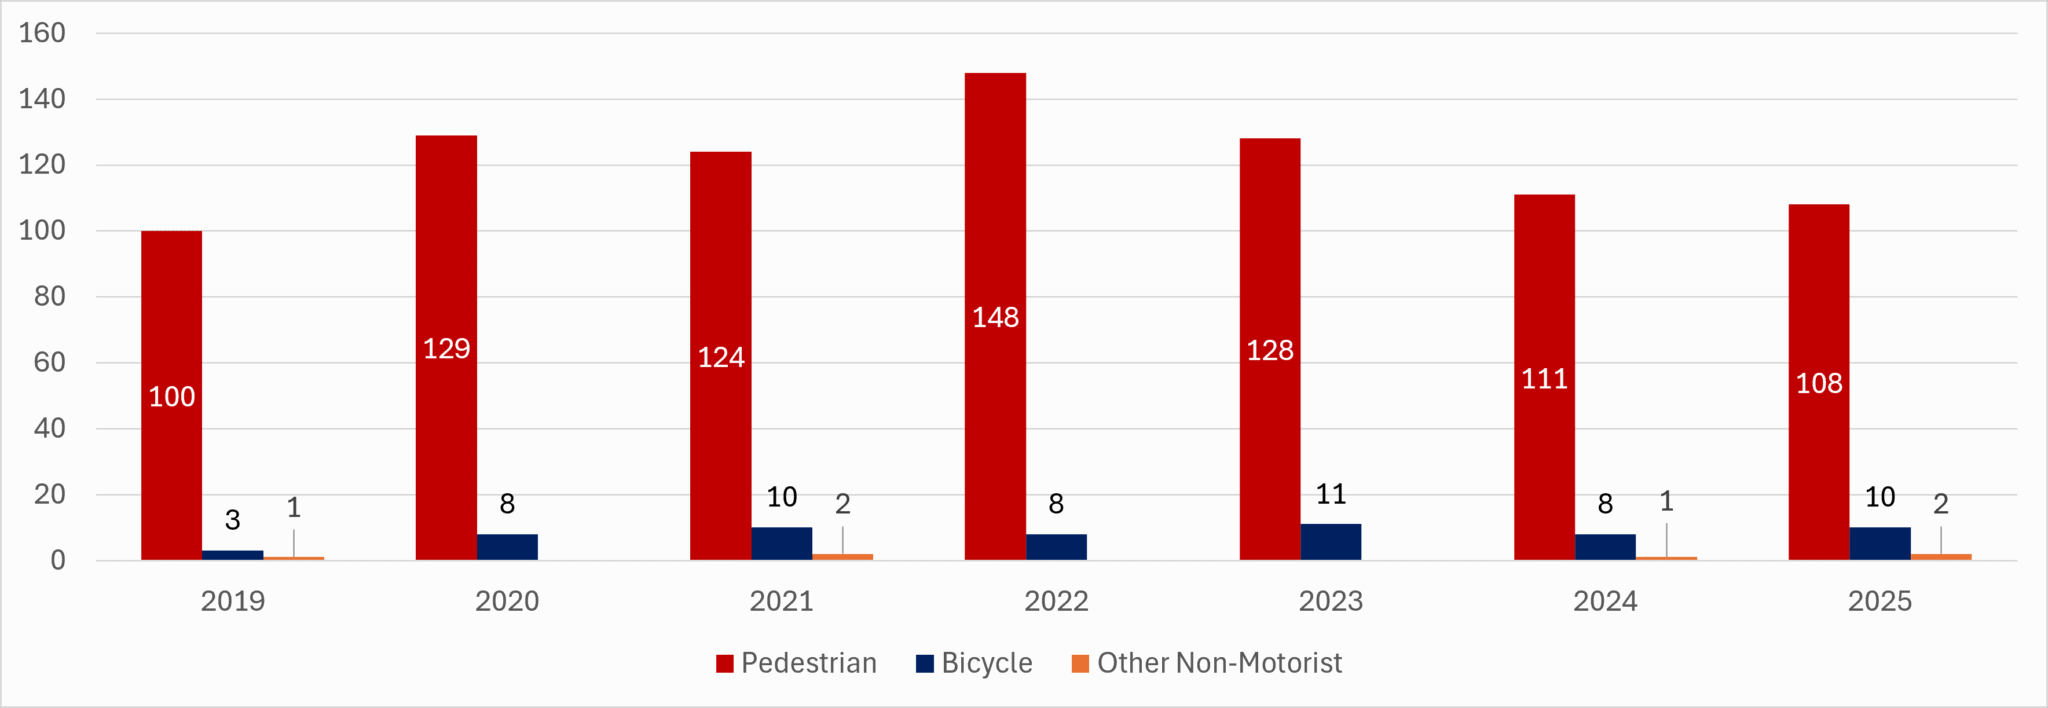
Vulnerable road users continue to experience a disproportionate share of severe traffic crashes in Memphis. While recent years have shown notable improvement from historic highs, progress flatlined in 2020 and annual totals have not yet been reduced to pre-pandemic (2019) levels.
Vulnerable Road User Crashes by Year
Vulnerable Road User Crash Reduction Progress and Future Targets
Actual/Current: shows actual crash trends observed to date, Needed Path to Target: represents the reduction needed to achieve adopted Safety Action Plan goals. Goal: Adopted target levels for 5, 10, and 15 year goals.
Historical Trend: summarizes the long-term pattern in observed crash data.